One of the most active areas of physics research today is in the area of fluid dynamics. The motion of fluids such as water and air are of key importance when designing systems such as cars, boats, airplanes, and space shuttles. The difficult part of fluid dynamics is that the equations of motion of fluids are particularly complex, with analytical solutions unavailable for all but the simplest of problems.In order to obtain meaningful answers, it is necessary to resort to computational methods, writing computer code to numerically simulate the flow of fluids in and around complex geometries such as airplane wings or jet turbines.
GlennHT is a program developed by NASA engineers to simulate the flow of fluids. Written in modular Fortran-95, this program is able to simulate fluid flow through arbitrary geometries, determining quantities of interest such as pressure, velocity, and energy of the flow. During my tenure at NASA, I worked on three major segments of the GlennHT workflow.
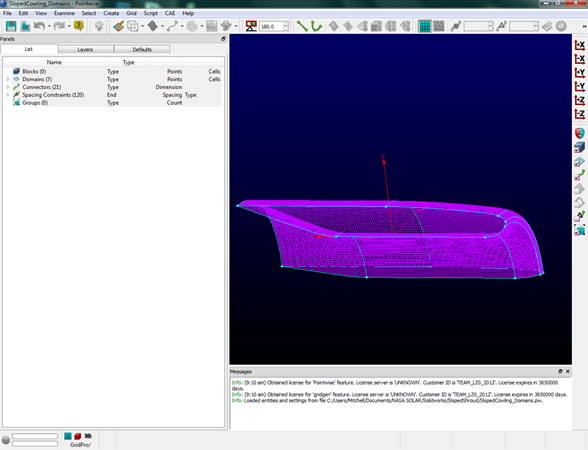
One of the preliminary steps for computational fluid dynamic simulations (CFD) is the generation of a mesh. A mesh is simply a list of the points at which the simulation will solve the physical equations of motion to approximate the fluid flow. There are various software packages that are used for this purpose. Traditionally, users of GlennHT used a program called GridPro® in order to generate the mesh. While Gridpro® is a powerful tool, it is not an industry-standard tool, as it is clunky and has a steep learning curve. One of the more popular programs in use today is the Pointwise® mesh generator. This program is more commonly used due to its easy user interface and its integration with other tools such as Solidworks®. In order to convert the output files from Pointwise® into something that the GlennHT solver can use, I developed a plugin using the Pointwise® C++ API. This allowed the user to export the generated mesh, to be used in the GlennHT solver.
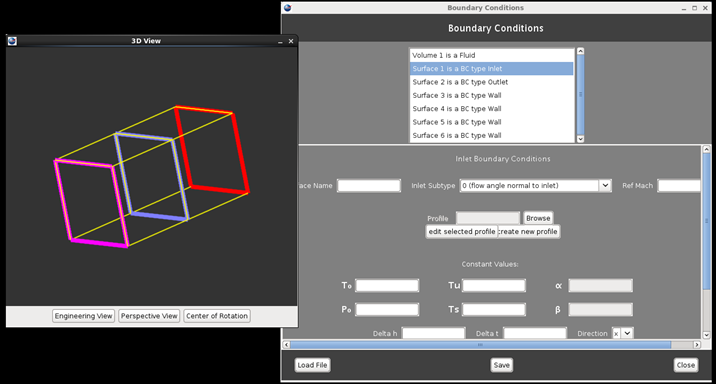
GlennHT is a command line tool that depends on many complex input files, which makes it very difficult to use for a user not intimately familiar with the software. To mitigate this, a graphical user interface (GUI) is under development. This GUI generates the necessary input files that, along with the mesh generated from Pointwise® or Gridpro®, will allow the user to perform a simulation. In addition to fixing numerous small bugs, my primary contribution to this portion of the project was to add 3-d visualization. Part of the GlennHT workflow involves identifying surfaces on the simulation, and specifying boundary conditions. These boundary conditions are necessary to constrain the results of the simulation, verifying that a unique solution is obtained. Previously, there was a bit of guesswork in identifying the surfaces to which the boundary conditions were applied, as the labels were only textual. With the 3-d visualizer, shown below, one could easily see to which surface a boundary condition was being applied, verifying that the simulation was being set up correctly. The final upgrade to the GUI was adding the ability to merge multiple meshes generated in multiple different files together into a single grid. This is a useful feature as a complex part is oftentimes split into different grids to simplify mesh generation. Again, the 3-d visualizer was a useful tool to ensure that the grid was being parsed correctly.
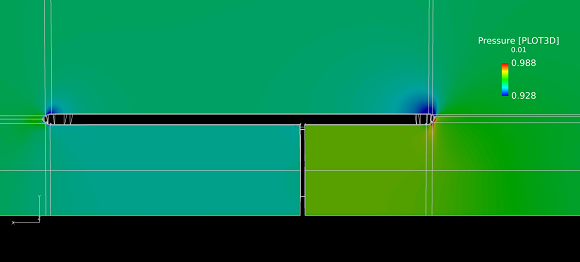
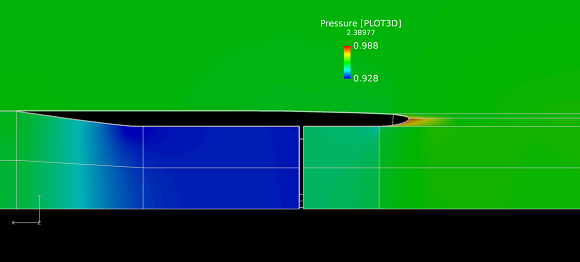
In order to verify that the tools were working correctly, I ran a few simulations on the SEA multi-element probe. This device consists of a few wires inside of a shroud that are kept at a high temperature through supporting electronics. By measuring the amount of energy required to keep the wires hot, one can determine the water concentration in the air and the approximate distribution of droplet sizes. This probe is used extensively in the ice tunnel at NASA’s Glenn Research Center. I ran two simulations on two different shroud geometries. A cut-out view of the probes can be seen below: the black area represents a solid object. The wires were modeled as a solid with a constant pressure drop to speed up the simulation. In the upper geometry with the flat shroud, notice how the pressure drops at the intake of the probe. This is an undesirable characteristic; it causes the measurements to be inaccurate. In the second probe the tapered shroud causes additional air to be sucked through the device, mitigating the effects of the wires blocking the airflow (Technical note: contrary to standard practice, airflow is from right to left in this picture).